Project Background
Alzheimer’s diseases affects more than 40 million people worldwide and the diagnosis of the disease relies on the testing of mental abilities (for example with memory tests), blood test, and brain scans. More than 20 gene variants have been linked to Alzheimer’s, however it seems like these genes only affect the chance that a person will develop Alzheimer’s, but not directly cause it. This research focused on 793 patients’ genetic information, and the aim was to create a computational tool, a method, that can effectively predict whether someone would develop Alzheimer’s disease or not, just by analysing the genetic differences between individuals. The research revealed that the method used could predict Alzheimer’s disease with a hundred percent certainty if ran with two alternate groups, and more than ninety percent certainty if ran with four patient groups (not affected, EMCI, LMCI, AD). This ‘tool’ was taught with known cases, and then it was tested with hidden patient information. These findings need further approval and testing, but it is very promising.
Methodology
Data
Single Nucleotide Polymorphism (SNP) is a variation in the DNA sequence that occurs at a specific position in
the genome.
Even a single mutation can be the cause of a disease, such as sickle cell anaemia or phenylketonuria,
however usually
SNPs do not function individually.
The dataset was provided by the Alzheimer’s Disease Neuroimaging Initiative (ADNI) in the form of variant
call files
(one file per patient) and each file had an average of four million rows, one row for each SNP for a
particular patient.
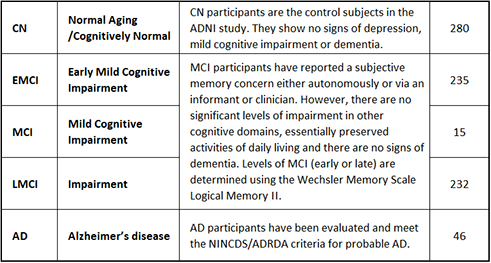
The subjects were divided into five groups:
- Normal Aging / Cognitively Normal (CN): participants are the control subjects in the ADNI study. They show no signs of depression, mild cognitive impairment or dementia.
- Early Mild Cognitive Impairment (EMCI), Mild Cognitive Impairment (MCI), Late Mild Cognitive Impairment (LMCI): participants have reported a subjective memory concern either autonomously or via an informant or clinician. However, there are no significant levels of impairment in other cognitive domains, essentially preserved activities of daily living and there are no signs of dementia. Levels of MCI (early or late) are determined using the Wechsler Memory Scale Logical Memory II.
- Alzheimer’s disease (AD): participants have been evaluated and meet the NINCDS/ADRDA criteria for probable AD.
Distribution between cases:
Data pre-processing
Because of the high dimensionality of the data, the first step of the project was to filter the data and
select
which properties of the SNPs can be used for building a model.
The function of a protein depends on its structure, and the SNPs that are not in the exon part of the
genes,
have no effect on the structure of the particular protein, therefore this research ignored every SNPs
that
were not in exons.
Furthermore, the group of MCI patients were not used because of the low number of observations.
Feature selection
Vcf files from this data set had several properties, however only two seemed suitable as features for our models. Since these position of the mutations were always a single integer, it seemed logical to use them as features. However, after some testing, and further research, this idea was falsified, because of the insertions and deletions in the genome, the same SNP can be located at different positions at different patients. Finally, the RS IDs were chosen as “features” as in most of the cases these are unique. After further filtering, every patient's’ files ended up with an average of 55 thousand SNPs, and across the whole database, there were 243588 unique SNPs. These were converted to binary arrays, where every element of the array is linked to a unique SNP ID, and its value is one if the patient has that particular SNP or zero if the patient doesn’t. These arrays were used as feature vectors for the classification models. To overcome the “large p, small n” problem (few observations, many features), the Weiss and Indurkhya’s, Independent Significance Features Test was used to select particular features. This algorithm calculates the significance levels of the features, based on their ability to distinguish two classes.
Genetic Algorithm
To further reduce the selected features without loosing too much accuracy, Genetic Algorithm was used as a wrapper method:
- Population size: 100
- Mutation rate: 0.01
- Generations: 100
- Crossover: Standard one-point crossover pairs
- Chromosome length: 32 - 8277
- Selection: Roulette wheel
- Group combinations: 1-2, 1-3, 1-4, 2-3, 2-4, 3-4 (where 1: CN, 2: EMCI, 3: LMCI, 4: AD
Fitness function
A chromosome in the GA is a binary array, where every element translates for a feature. If the element
is one, the feature will be used for the classification, if it is zero, it will not be further
used.
The fitness function therefore, first chooses the features from the feature space (after the initial
filtering was done), then creates a cross validation partition of the observations (10% of the
observations).
The classification was done with a multi class Support Vector Machine (Linear classification model), and
it
was evaluated on
the testing partition by a confusion matrix.
The fitness value of an individual is calculated by two factors. First, the less features that the
model is has used, the higher is the significance value increases (the number of left out features).
The second factor is the true positive rate of the classification. If the classification result is less
than a 100%, the fitness value is simply set to zero, to make sure that the best chromosomes will
achieve a
100% positive true result.
Chromosome (Weiss/Indurkhya 'independent features' significance algorithm)
Choosing the length of the chromosomes was not straight forward because of the nature of the genetic
algorithm. A
simple approach was to set the length of the chromosome for the same number as the number of features
left
after
the filtering. This however did not work, because when the GA initialises the first population, it
initialises
the chromosomes randomly, and that sets around 50 percent of the values to zero. As an effect of this,
half
of
the features would not be used for the classifications during the fitness calculation, and the whole
population
would end up with zero significance value.
Therefore, within every group, several tests were necessary to identify the right length of the
chromosome.
A long
chromosome could have been a solution, but since the fitness function involves building a classification
model,
that would have made the calculation computationally heavy.
An interesting point is that sometimes, during these tests, the length of the chromosomes was set to
lower
than
the number of features after the filtering. This can be explained, by the way as the filter -and wrapper
feature
selection works. The filter simply filters the features one by one by their significance levels, and
does
not
check for connection between them. Therefore, when the combination of two features has a big effect on
the
classification, the filter can simply remove one of them, because of its low individual significance. On
the
other hand, the wrapper randomly selects the features, and if the results are positive, keeps certain
groups
of them.
For each group combinations, the progress of the GA shows, how the average fitness value of a population increased over the generations, which is the aim of the genetic algorithms.
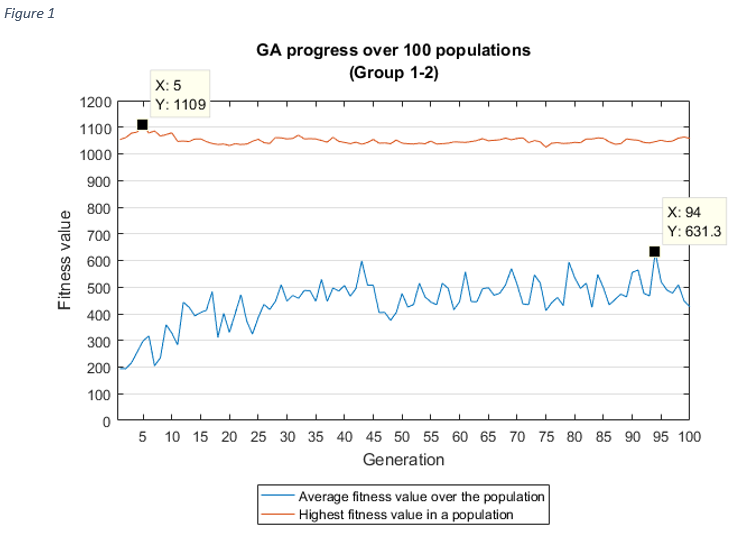

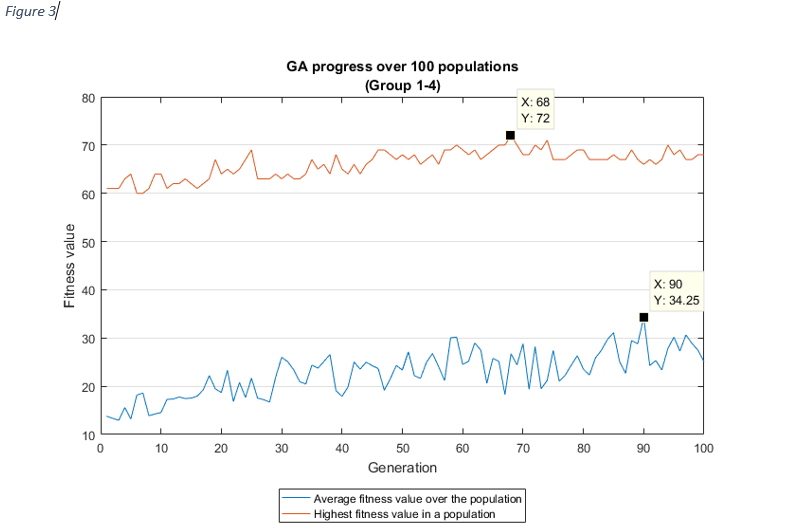
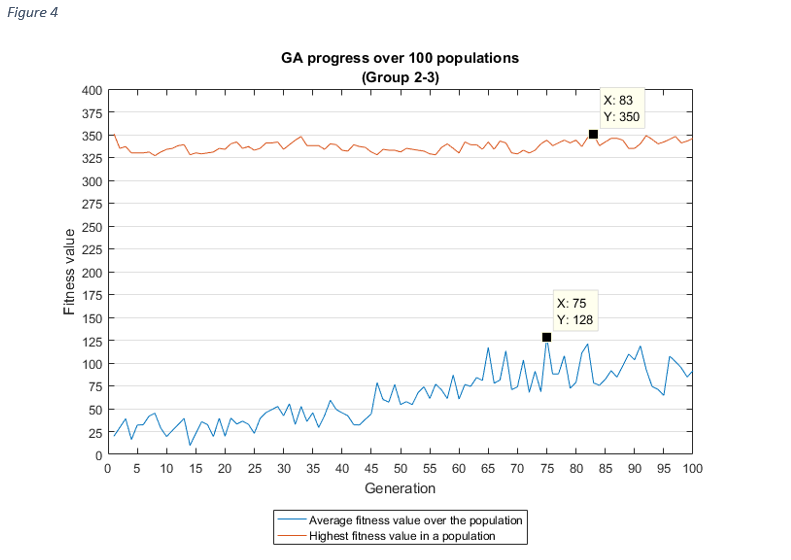

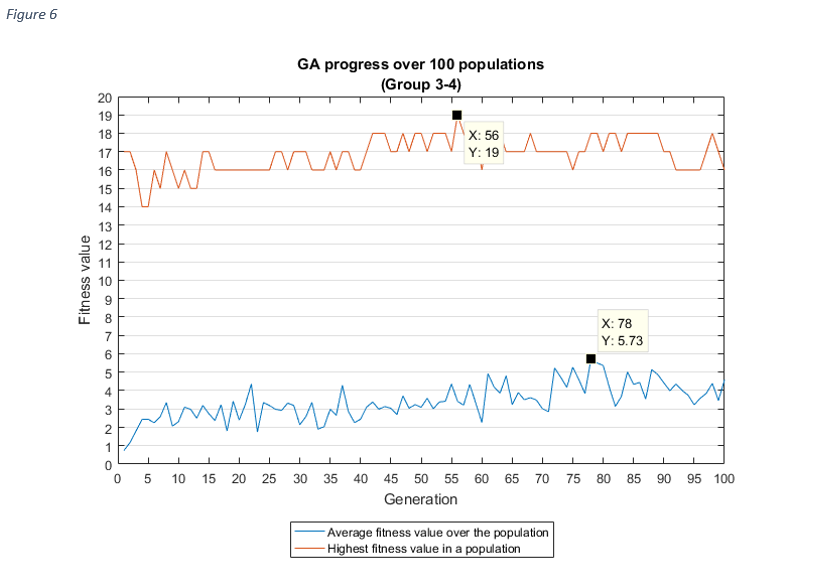
As it was expected, as the average fitness value was rising, the highest fitness value in a population
was
increasing
too, except at group 1-2 and group 1-3. In these cases, the best fitness value was discovered after the
first
couple of iterations, the reason for this might be related to the chromosome sizes (very high), but it
needs
further investigation.
By using GA as a search method for wrapper feature selection, the number of required features were
significantly dropped in most cases:
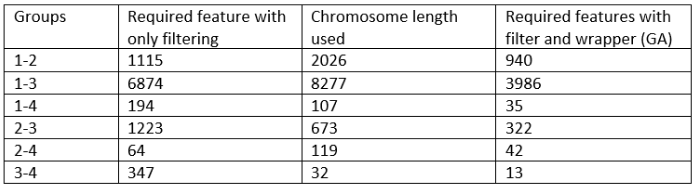
Using wrapper features selection with GA as the search method, significantly improved the results. The analysis of the result SNPs would also take less time therefore the chance to find a responsible gene for Alzheimer’s Disease is improved.
Results
The goal of the reasearch was to train a model that is able to identify patients with Alzheimer's disease by their genetic (SNP) data. All together there were more than 50 models trained, using different machine learning algorithms with various hyperparameters, such as: random forest (RF), decision tree (DT), and multi class models (MCM) with support vector machine (SVM) or linear learner (LL). The evaluation was done by confusion matrices, and the final results was calculated by dividing the number of test observations with the true positives (accuracy). Multi class models with linear learners outperformed the other algorithms by often achieving 95-98% accuracy:
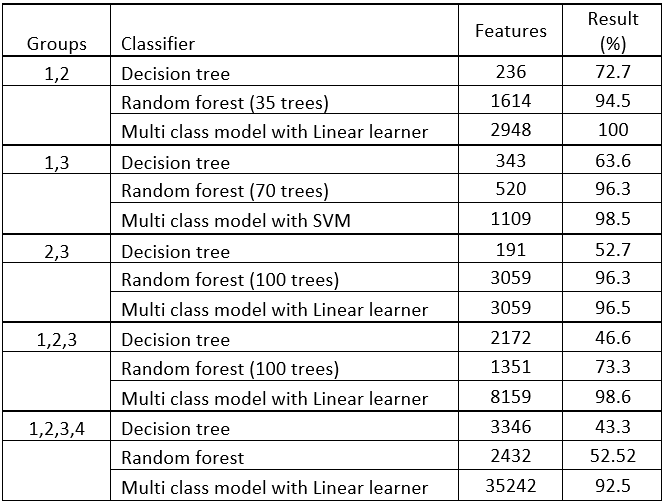
On the top of the classification results, the feature selection method, provided us with a significance level for each features (SNPs), which provides an opportunity to analyse the SNPs and possibly identify a new biomedical marker for Alzheimer's disease.
Technologies Used
The project was implemented in Matlab, along with a couple of C# scripts for pre-processing the data and store the metadata in Microsoft SQL database.